*本文原创作者:无。,本文属FreeBuf原创奖励计划,未经许可禁止转载
多数调试器都有一个代码跟踪(Trace)功能,可以记录程序运行时执行过的命令,有助于调试工具的使用者弄清代码的执行流程,但调试器提供的跟踪功能多是基于程序异常的,开启跟踪后会大幅降低程序运行速度。本文将介绍Intel出品的程序动态插桩工具Pin,并利用Pin实现性能损耗更小的代码追踪工具。
Intel Pin介绍
Pin是一个动态的二进制插桩工具。动态意味着它的插桩在运行时执行,而不需要程序的源码,这一点是十分契合逆向工程或是漏洞挖掘的要求的。关于Pin的实现原理,我在这里直接引用官方的说法:
“Pin intercepts the execution of the first instruction of the executable and generates (“compiles”) new code for the straight line code sequence starting at this instruction. It then transfers control to the generated sequence. The generated code sequence is almost identical to the original one, but Pin ensures that it regains control when a branch exits the sequence. After regaining control, Pin generates more code for the branch target and continues execution.”
简而言之,Pin会将原程序的代码拆分为各个小块,当程序执行到其中每一块的开头时,Pin会根据这一块代码的内容生成新的代码(例如在原始代码中插桩,对代码进行修改, 保存、恢复执行环境等等),然后将控制权转交给新生成的代码;当新生成的代码执行结束后,Pin重新获得控制权,然后再对下一块代码进行处理。因此,被插桩程序中的原始指令仅仅只是作为一个参照,并没有被执行,被执行的是由Pin动态生成的新指令。
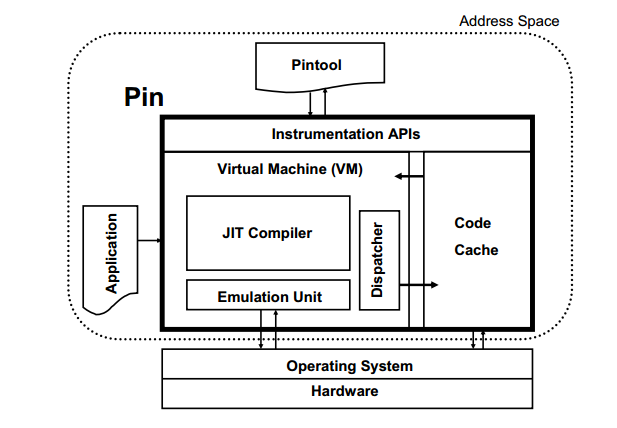
整个Pin的架构如下
前期准备
Pin套件可在其官网下载(https://software.intel.com/en-us/articles/pin-a-binary-instrumentation-tool-downloads)
另外,若在Windows上使用Pin,最好还下载Cygwin,并在其默认安装中额外添加’make’工具,以便我们后续编译我们自己写的Pin工具.
代码跟踪工具编写
在编写工具前,我们首先整理一下思路:
本工具只跟踪程序的执行流程,不需要详细记录每一条指令前后的寄存器变化。
根据第一条,我们的插桩粒度只需要做到基本块的级别。
在每一个基本块执行前插入代码,保存当前程序的pc计数器,并将该信息写入文件保存。
由于ALSR的存在,我们还需要保存模块的装载地址,否则第三点记录的地址便没有意义。
为了避免追踪到系统模块造成不必要的性能开销,我们暂时只对可执行程序主体模块进行插桩。
在理清思路后,我们开始代码的编写。首先是main函数的总体框架:
#include <iostream>
#include <fstream>
#include <string>
#include <set>
#include "pin.h"

ofstream out;
int main(int argc, char *argv[]) {
    if (PIN_Init(argc, argv))
        return usage();
    out.open("PIN_Trace.tlog");
    IMG_AddInstrumentFunction(Image, 0);
    TRACE_AddInstrumentFunction(Trace, 0);
    PIN_AddFiniFunction(Fini, 0);
    PIN_StartProgram();
    return 0;
}
PIN_Init()函数用来初始化Pin框架,若初始化失败则执行usage()函数,显示错误信息。
IMG_AddInstrumentFunction(Image, 0)注册了一个名为‘Image’的回调函数,该函数将在每一个程序映像被装载时调用。下面是Image函数的具体实现:
void Image(IMG img, void * v) {
    if (IMG_IsMainExecutable(img)) {
        char temp[1024];
        sprintf(temp, "%s loaded at %p", IMG_Name(img).c_str(), (void *)IMG_StartAddress(img));
        out << temp << endl;
    }
}
代码很好理解,记录下程序主模块的装载基地址并记录在文件中。
我们回到main函数,TRACE_AddInstrumentFunction(Trace, 0)同样注册了名为Trace的回调函数。Trace的实现如下:
void Trace(TRACE trace, void * v) {
    if (!IMG_IsMainExecutable(IMG_FindByAddress(TRACE_Address(trace))))
        return ;

    BBL bbl = TRACE_BblHead(trace); //返回本次Trace的第一个基本块
    for (; BBL_Valid(bbl); bbl = BBL_Next(bbl)) {
        BBL_InsertCall(bbl, IPOINT_BEFORE, (AFUNPTR)BBLHit, IARG_INST_PTR, IARG_END);
    }

}
Trace函数首先判断本次Trace是不是在程序主模块中,若不是则直接返回,不进行插桩。然后遍历本次Trace中的每一个基本块,BBL_InsertCall()中的’IPOINT_BEFORE’参数指定了在基本块执行前进行插桩,插入的函数为BBLHit。于是我们只需要在BBLHit函数中进行代码地址的登记即可。
set<string> stringSet;

void BBLHit(void *ip) {
    char temp[1024];
    sprintf(temp, "%p", ip);
    string str1(temp);
    if (stringSet.find(str1) == stringSet.end()) {
        stringSet.insert(str1);
        out << temp << endl;
    }
}
在上述的BBLHit函数中,我还额外用了一个set保存已登记的基本块,避免一个基本块被多次记录。当然,是否需要重复记录这一点根据不同的任务需要会有不同的结论。
由于PIN_StartProgram()这个函数是不会返回的,所以一些清理工作(例如关闭所打开的文件)需要用PIN_AddFiniFunction()这个函数来完成。这部分就不再赘述了。至此,Pintool已编写完成。
编译、运行Pintool
对Windows平台来说,从官方下载的Pin sdk中的%PIN_DIR%\source\tools\MyPinTool是一个Visual Studio的项目,也是一个pintool的开发模板。你可以直接把上述代码复制到MyPinTool项目中然后编译。
或者你可以先将写好的代码复制入MyPinTool.cpp中,然后利用之前下载好的Cygwin,进入Cygwin Terminal,切换至该文件夹并输入’make’即可完成编译。
Linux平台也可以用类似的方法编译pintool,此处不再赘述。
我们的pintool将会被编译成.so或者.dll的形式。编译完成后,我们用下面的命令行运行它。pin [Pin Args] [-t <Tool DLL> [Tool Args]] -- <App EXE> [App args]
例如pin -t e:\myPinTool.dll -- cmd /c dir
skd中根目录下的pin.exe其实是一个启动器,会根据实际情况启动32位或64位的真正的pin.exe。或者你也可以进入ia32或intel64文件夹,直接用该目录下的pin主程序。
执行完毕之后,我们打开PIN_Trace.tlog文件,可以看到代码追踪的结果。
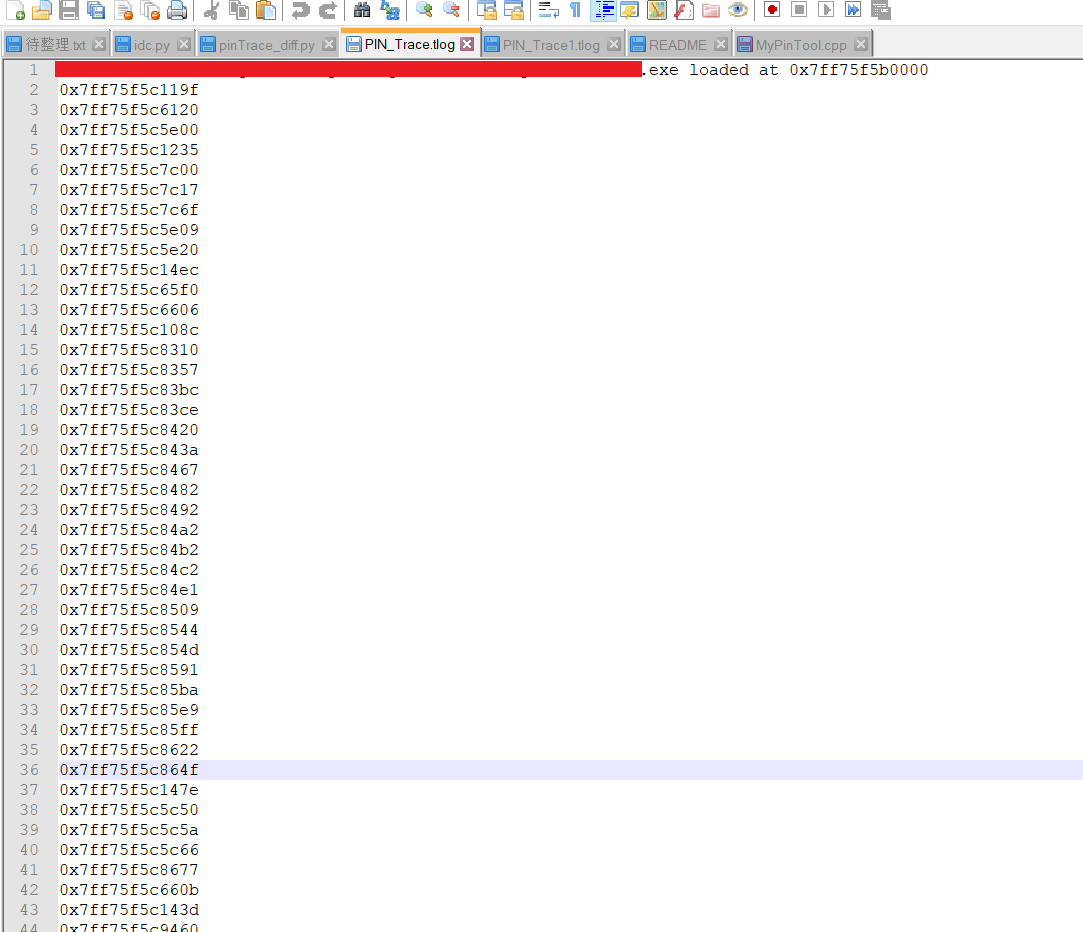
结果很不错,程序运行基地址和执行到的基本块的地址都被记录了下来。不过缺点显而易见:太丑!
跟踪结果可视化
在这里,我们通过IDA脚本读取上述的PIN_Trace.tlog文件的内容,并将追踪结果用直观的形式表现出来。具体地,我们完成以下几个目标:
在IDA的图像界面把每个跟踪到的基本块上色。
建立一个侧边栏方便我们查询和选取跟踪记录。
相比于IDA的原生脚本IDC而言,IDAPython脚本更容易开发,代码也相对更易读懂。因此我们用IDAPython实现上述目标。
由于IDA中假设的基地址和实际运行时的基地址并不一定相同,我们首先读取tlog文件中记录的基地址,并将IDA中预设的基地址调整到这个位置上来。
#get the trace log generated by PIN
fileName = AskFile(1, "*.tlog", "Load the trace file")

#parse log file
res = ReadTraceFromFile(fileName)
addr_list = res[0]
base_in_file = res[1]

#rebase the program
base_addr = AskStr(defval=base_in_file, prompt="Enter the base address.")
base_addr = int(base_addr, base=16)
delta = base_addr - idaapi.get_imagebase()
rebase_program(delta, MSF_FIXONCE)
我们将采用SetColor这一API进行上色,但是SetColor是针对于指令的,而我们记录的是基本块的位置,因此,我们需要找到给定基本块对应的所有指令地址, 然后再用SetColor给每一条指令上色。
def SetBBColor(ea, color):
    f = idaapi.get_func(ea)
    if not f:
        SetColor(ea, CIC_ITEM, color)
        return
    fc = idaapi.FlowChart(f)
    tag = False
    for BB in fc:
        if BB.startEA <= ea:
            if BB.endEA > ea:
                tag = True
                break
    if not tag:
        print 'No BB found! ea is %x' % ea
        SetColor(ea, CIC_ITEM, color)
        return
    for ea in range(BB.startEA, BB.endEA):
        SetColor(ea, CIC_ITEM, color)
上色部分结束。接下来,我们需要新建一个Chooser窗口,将追踪到的基本块的列表展现在此窗口中。并且,当用户双击列表中的项目时IDA将自动导航至该基本块的位置。
我们通过继承IDAPython中的Choose2类来实现这个目标。
class TraceChooser(Choose2):
    def __init__(self, title, cols, embedded = False):
        Choose2.__init__(self, title, cols, embedded = False)
        self.items = []

    def GetItem(self, n):
        return self.items[n]

    def AddItem(self, item):
        self.items.append(item)

    def OnGetLine(self, n):
        return self.items[n]

    def OnGetSize(self):
        return len(self.items)

    def OnSelectLine(self, n):
        item = self.GetItem(n)
        idc.Jump(long(item[0], 16))
整个IDAPython脚本的代码如下:
def ReadTraceFromFile(fileName):
    file = open(fileName)
    addr_list = []
    try:
        fileLine = file.readline()
        idx = fileLine.rfind('loaded at ')
        if (-1 == idx):
            print 'parse file failed!'
            return
        idx += len('loaded at ')
        base = fileLine[idx:]
        msg('base address in tlog is %s' % base)
        while (True):
            fileLine = file.readline()
            addr_list.append(int(fileLine, 16))
    finally:
        file.close()
        return [addr_list, base]

def SetBBColor(ea, color):
    f = idaapi.get_func(ea)
    if not f:
        SetColor(ea, CIC_ITEM, color)
        return
    fc = idaapi.FlowChart(f)
    tag = False
    for BB in fc:
        if BB.startEA <= ea:
            if BB.endEA > ea:
                tag = True
                break
    if not tag:
        print 'No BB found! ea is %x' % ea
        SetColor(ea, CIC_ITEM, color)
        return
    for ea in range(BB.startEA, BB.endEA):
        SetColor(ea, CIC_ITEM, color)

class TraceChooser(Choose2):
    def __init__(self, title, cols, embedded = False):
        Choose2.__init__(self, title, cols, embedded = False)
        self.items = []

    def GetItem(self, n):
        return self.items[n]

    def AddItem(self, item):
        self.items.append(item)

    def OnGetLine(self, n):
        return self.items[n]

    def OnGetSize(self):
        return len(self.items)

    def OnSelectLine(self, n):
        item = self.GetItem(n)
        idc.Jump(long(item[0], 16))

#get the trace log generated by PIN
fileName = AskFile(1, "*.tlog", "Load the trace file")

#parse log file
res = ReadTraceFromFile(fileName)
addr_list = res[0]
base_in_file = res[1]

#rebase the program
base_addr = AskStr(defval=base_in_file, prompt="Enter the base address.")
base_addr = int(base_addr, base=16)
delta = base_addr - idaapi.get_imagebase()
rebase_program(delta, MSF_FIXONCE)

#inititalize the chooser
tc = TraceChooser('TraceChooser', [['Address', 10], ['Function', 10]])

for ea in addr_list:
    #SetBBColor(ea, 0xFFFFFF)
    SetBBColor(ea, 0xFFDEAD)
    temp = ['{0:X}'.format(ea), get_func_name(ea)]
    tc.AddItem(temp)

tc.Show()
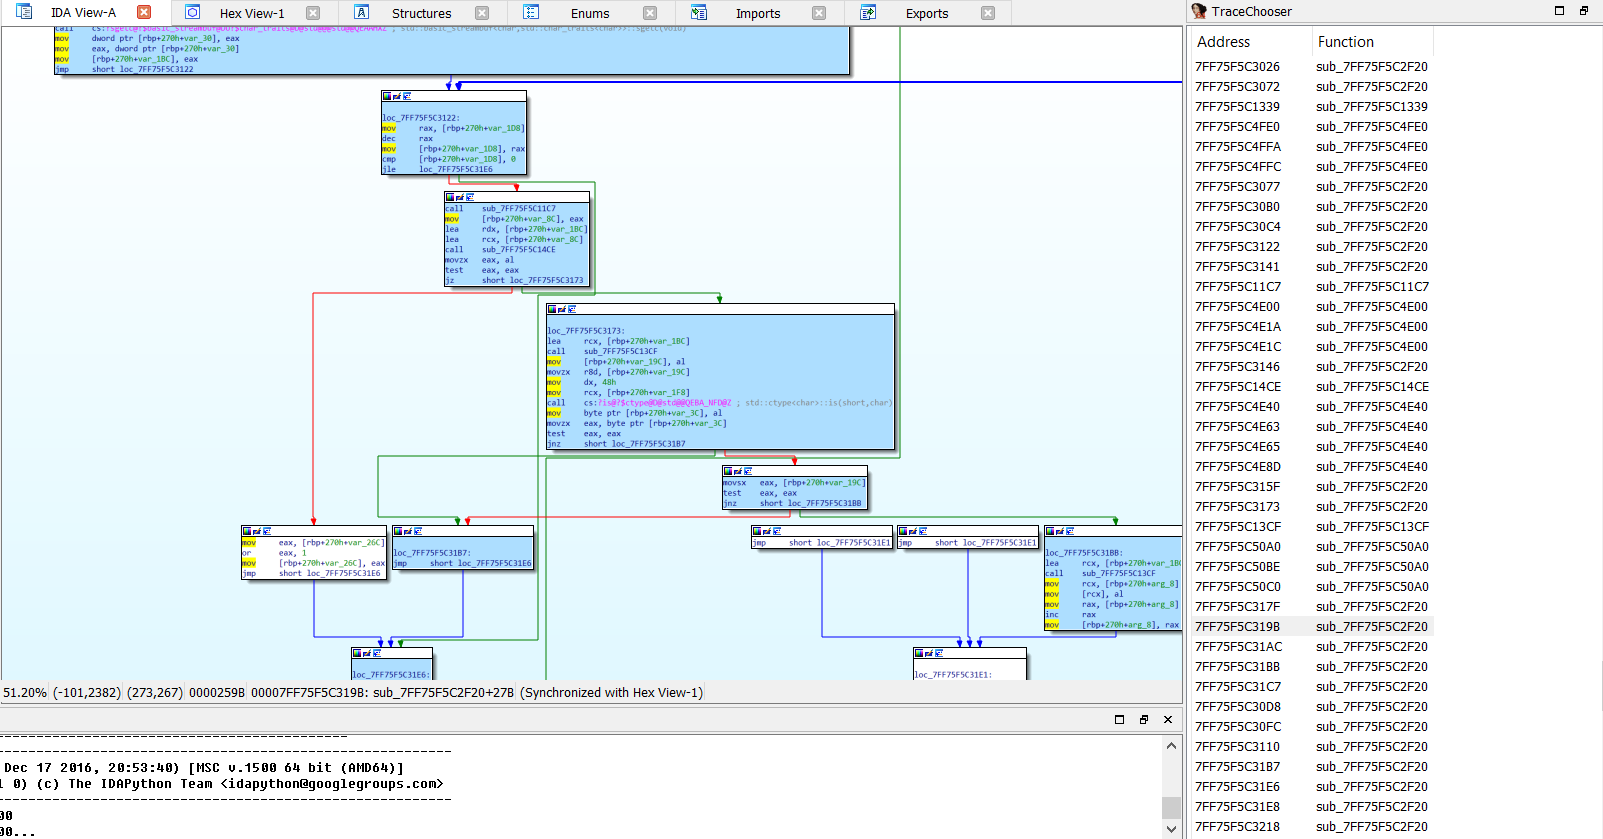
最后我们在IDA中能看到这个效果
总结
Intel Pin是一个非常优秀的二进制插桩工具,用它实现的代码追踪相比于传统的追踪方式速度更快。本文阐述的追踪方式仅仅是一个粗糙的示例性的代码,希望能激发大家创建更加优秀的pintools。
Reference
https://www.hex-rays.com/products/ida/support/idapython_docs/
https://software.intel.com/sites/landingpage/pintool/docs/97619/Pin/html/
*本文原创作者:无。,本文属FreeBuf原创奖励计划,未经许可禁止转载
来源:freebuf.com 2018-08-16 10:00:41 by: 无。


请登录后发表评论
注册