一、kibana介绍(来自百度百科)
kibana是一个与elasticsearch一起工作的开源的分析和可视化平台。使用kibana可以查询、查看并与存储在elasticsearch索引的数据进行交互操作。使用kibana能执行高级的数据分析,并能以图表、表格和地图的形式查看数据。
kibana使得理解大容量的数据变得非常容易。它非常简单,基于浏览器的接口使我们能够快速的创建和分享显示elasticsearch查询结果实时变化的仪表盘。
在elasticsearch5版本之前,一般都是通过安装kibana,而后将marvel、hand等各种功能插件添加到kibana上使用。在elasticsearch 5 版本之后,一般情况下只需要安装一个官方推荐的x-pack扩展包即可。
二、安装
请选择你系统中的下载安装命令来下载安装Kibana。
(deb for Debian/Ubuntu, rpm for Redhat/Centos/Fedora, mac for OS X, and win for Windows).
deb or rpm:
curl -L -O https://artifacts.elastic.co/downloads/kibana/kibana-6.3.1-linux-x86_64.tar.gz
tar xzvf kibana-6.3.1-linux-x86_64.tar.gz
cd kibana-6.3.1-linux-x86_64/
./bin/kibana
mac:
curl -L -O https://artifacts.elastic.co/downloads/kibana/kibana-6.3.1-darwin-x86_64.tar.gz
tar xzvf kibana-6.3.1-darwin-x86_64.tar.gz
cd kibana-6.3.1-darwin-x86_64/
./bin/kibana
win:
1. Download the Kibana 6.3.1 Windows zip file from the Kibana download page.(下载安装包)
2. Extract the contents of the zip file to a directory on your computer, for example, C:\Program Files.(解压安装包)
3. Open a command prompt as an Administrator and navigate to the directory that contains the extracted files, for example:
cd C:\Program Files\kibana-6.3.1-windows(以管理员身份打开命令行并切换到指定目录)
4. Start Kibana:
bin\kibana.bat(开始运行kibana)
三、运行测试
启动完毕后,在浏览器输入http://localhost:5601即可看到kibana页面
 四、检查kibana状态
 四、检查kibana状态
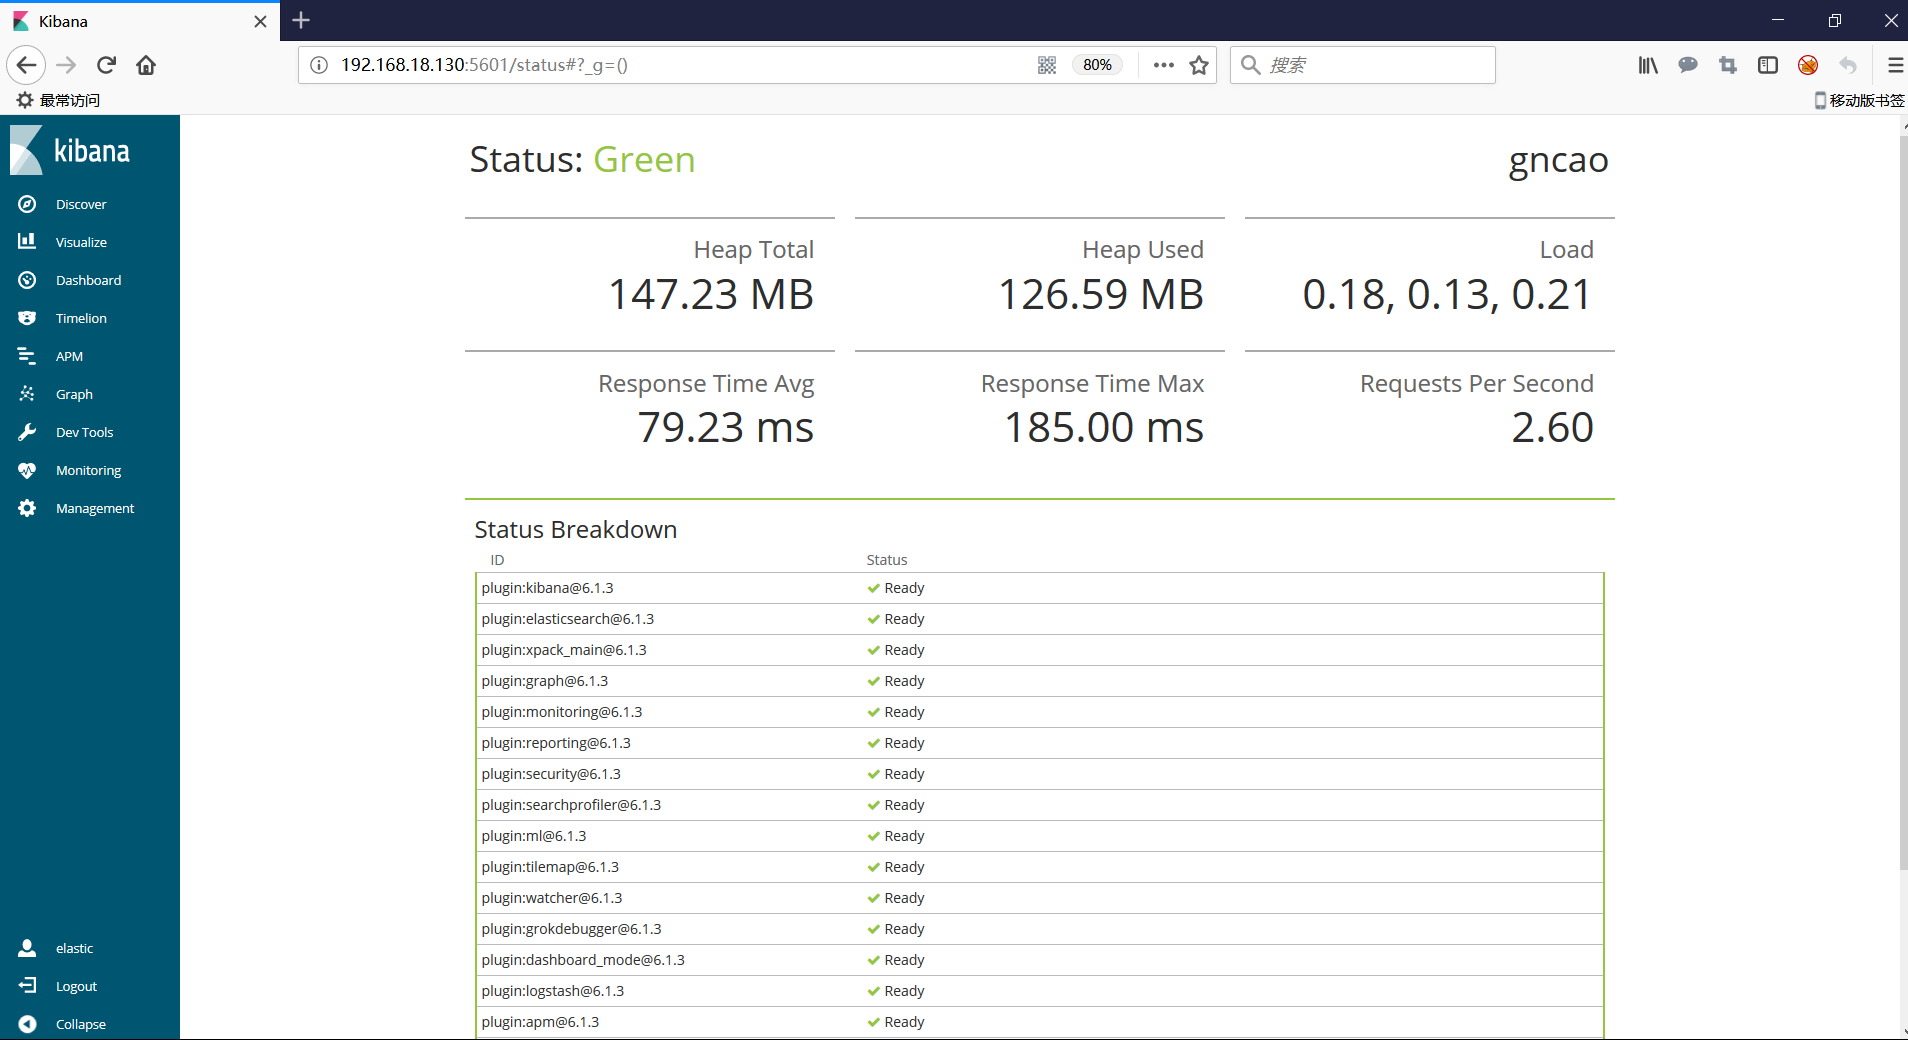
可以通过访问localhost:5601/status来访问kibana的服务器状态页,状态页展示了服务器资源使用情况和已经安装插件列表情况。
五、配置外部访问
默认情况下,kibana的运行地址是127.0.0.1,也就是说其他主机访问不了该服务。如果想要其他主机访问kibana,那么就需要更改kibana.yml文件。
修改方法是编辑kibana.yml文件,修改server.host内容为服务器IP即可。
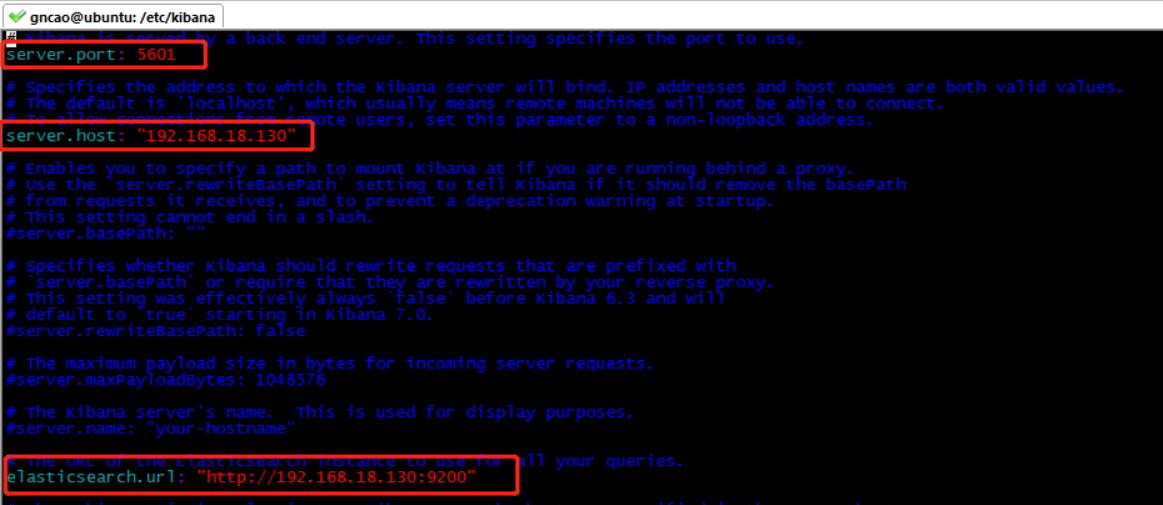 上图中第一个框为kibana运行端口号;server.host为kibana服务器IP;elasticsearch.url表示要连接的elasticsearch的IP地址和端口。
保存后重启该服务。
注:如果是手动安装的kibana,那么你肯定知道安装目录在哪里了;如果是通过上述方式安装的,那么默认情况下,安装目录是/etc/kibana;如果还是找不到目录,就直接find / -name kibana.yml文件就好了。
六、kibana常用配置
6.1,加载示例数据
1)首先为莎士比亚数据集和日志数据集建立映射
莎士比亚数据集:
root@ubuntu:/home/gncao/elk# curl -X PUT “localhost:9200/shakespeare” -H ‘Content-Type: application/json’ -d’
{
“mappings”: {
“doc”: {
“properties”: {
“speaker”: {“type”: “keyword”},
“play_name”: {“type”: “keyword”},
“line_id”: {“type”: “integer”},
“speech_number”: {“type”: “integer”}
}
}
}
}
‘
> {
> “mappings”: {
> “doc”: {
> “properties”: {
> “speaker”: {“type”: “keyword”},
> “play_name”: {“type”: “keyword”},
> “line_id”: {“type”: “integer”},
> “speech_number”: {“type”: “integer”}
> }
> }
> }
> }
> ‘
{“acknowledged”:true,”shards_acknowledged”:true,”index”:”shakespeare”}
日志数据集:
root@ubuntu:/home/gncao/elk# curl -X PUT “localhost:9200/logstash-2015.05.18” -H ‘Content-Type: application/json’ -d’
> {
> “mappings”: {
> “log”: {
> “properties”: {
> “geo”: {
> “properties”: {
> “coordinates”: {
> “type”: “geo_point”
> }
> }
> }
> }
> }
> }
> }
> ‘
{“acknowledged”:true,”shards_acknowledged”:true,”index”:”logstash-2015.05.18″}root@ubuntu:/home/gncao/elk#
root@ubuntu:/home/gncao/elk#
root@ubuntu:/home/gncao/elk# curl -X PUT “localhost:9200/logstash-2015.05.19” -H ‘Content-Type: application/json’ -d’
> {
> “mappings”: {
> “log”: {
> “properties”: {
> “geo”: {
> “properties”: {
> “coordinates”: {
> “type”: “geo_point”
> }
> }
> }
> }
> }
> }
> }
> ‘
{“acknowledged”:true,”shards_acknowledged”:true,”index”:”logstash-2015.05.19″}root@ubuntu:/home/gncao/elk# curl -X PUT “localhost:9200/logstash-2015.05.20” -H ‘Content-Type: application/json’ -d’
> {
> “mappings”: {
> “log”: {
> “properties”: {
> “geo”: {
> “properties”: {
> “coordinates”: {
> “type”: “geo_point”
> }
> }
> }
> }
> }
> }
> }
> ‘
{“acknowledged”:true,”shards_acknowledged”:true,”index”:”logstash-2015.05.20″}
2)然后开始加载数据
加载莎士比亚数据集:
curl -H ‘Content-Type: application/x-ndjson’ -XPOST ‘localhost:9200/shakespeare/doc/_bulk?pretty’ –data-binary @shakespeare_6.0.json
加载日志数据集:
curl -H ‘Content-Type: application/x-ndjson’ -XPOST ‘localhost:9200/_bulk?pretty’ –data-binary @logs.jsonl
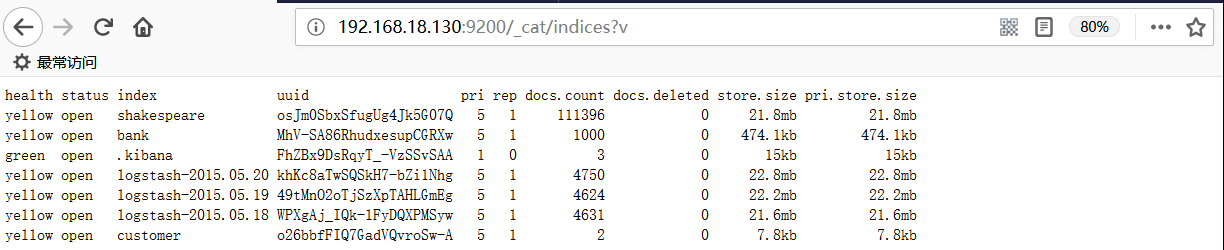
3)查看是否加载成功
http://192.168.18.130:9200/_cat/indices?v
 6.2 Discovery页面
Discover页面可以查看到当前存储的所有日志信息。通过该页面可以提交搜索请求、过滤搜索结果、查看文档数据。还可以看到与搜索查询匹配的文档树,并获取字段值的统计信息。如果索引模式配置了时间字段,还可以在当前页面的顶部看到基于时间的分布的文档数量柱状图。
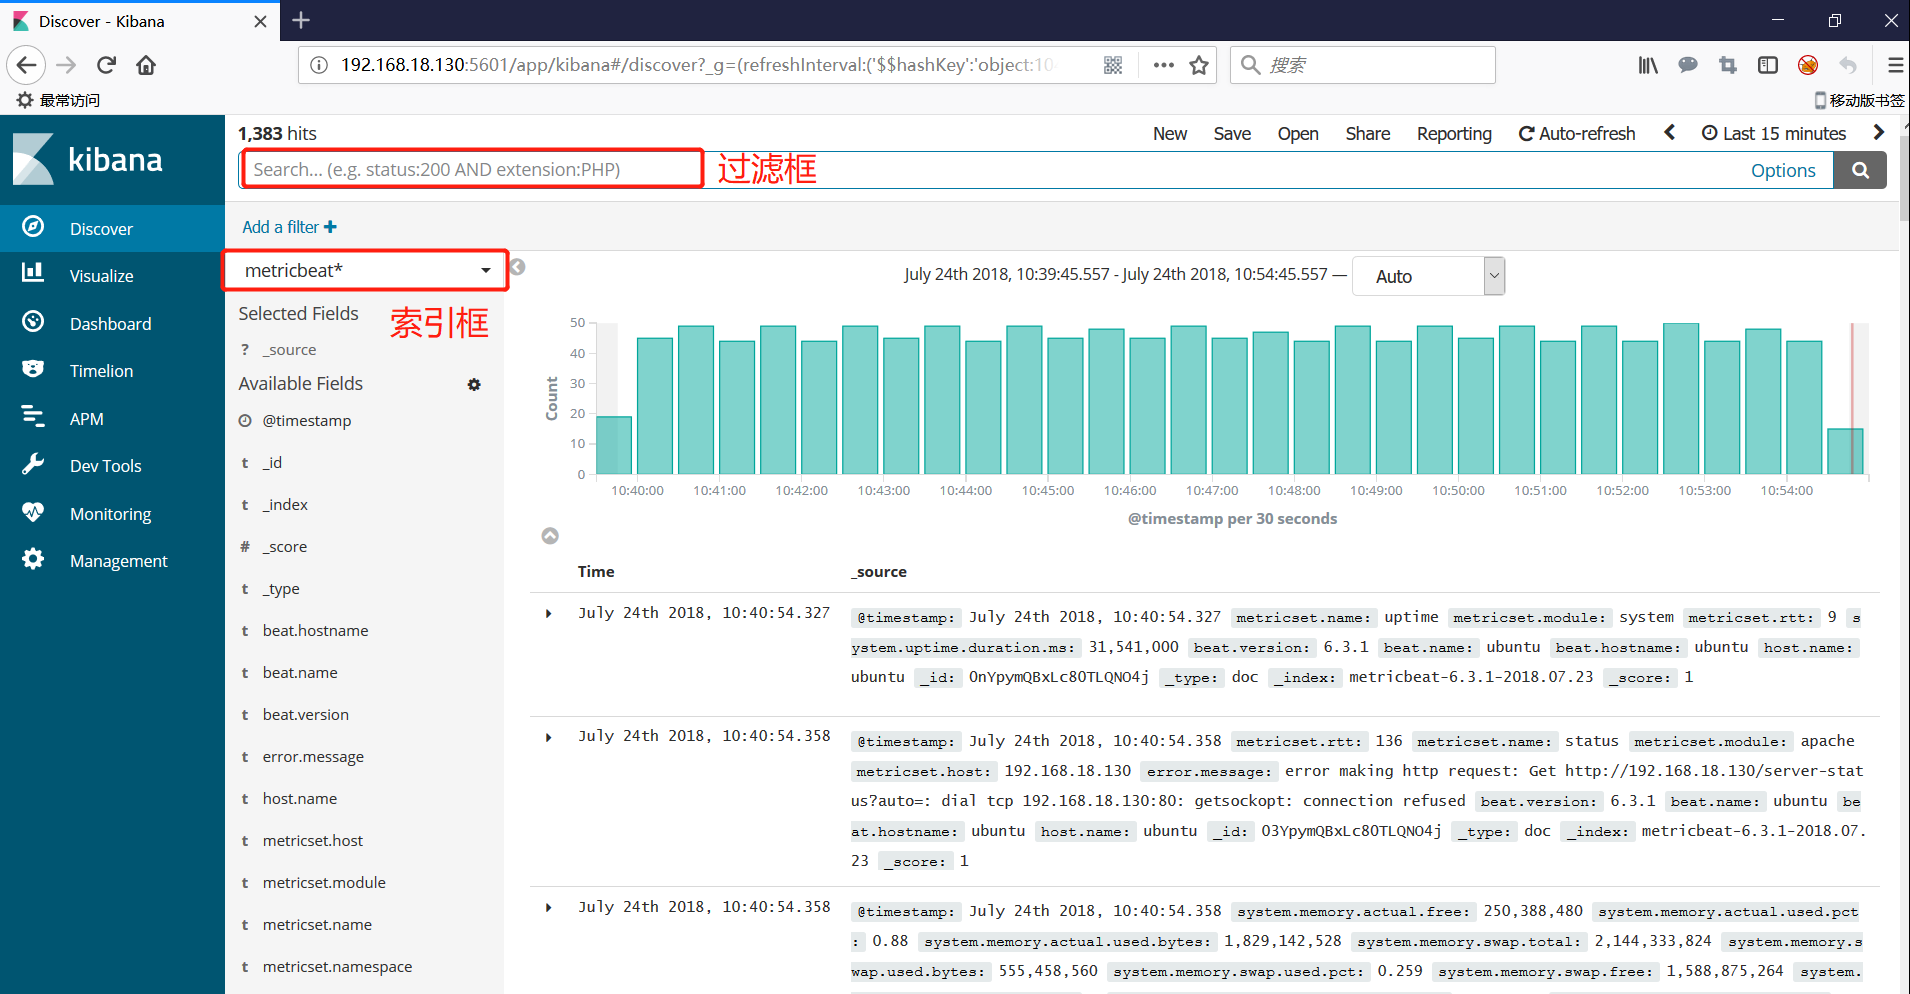
注:索引模式需要在管理页面下创建。
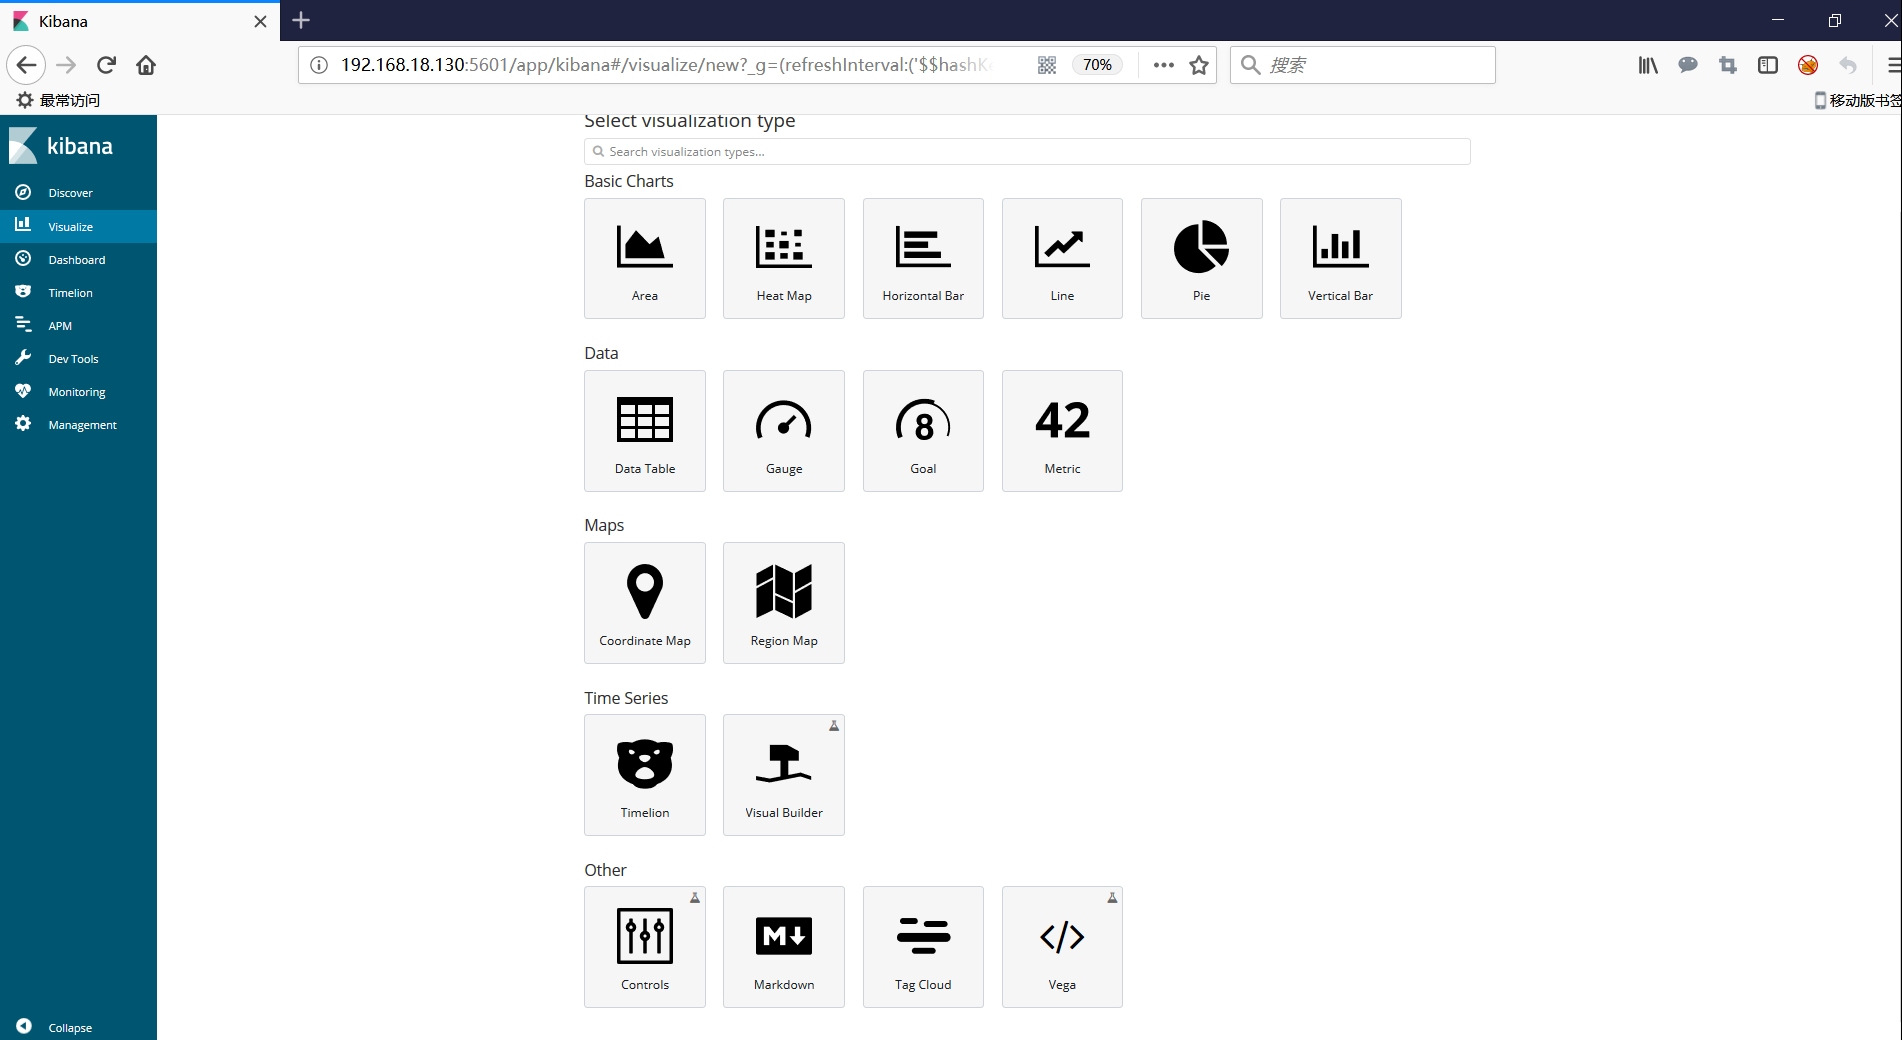
6.3,可视化
可视化功能可以为Elasticsearch数据创建可视化控件。然后可以通过创建仪表盘(Dashboard)将这些可视化控件整合到一起展示。
常用的可视化控件有:线形图、区域图、条形图、数据表、Markdown控件、指标、饼图、Tile地图、标签云、热点图。
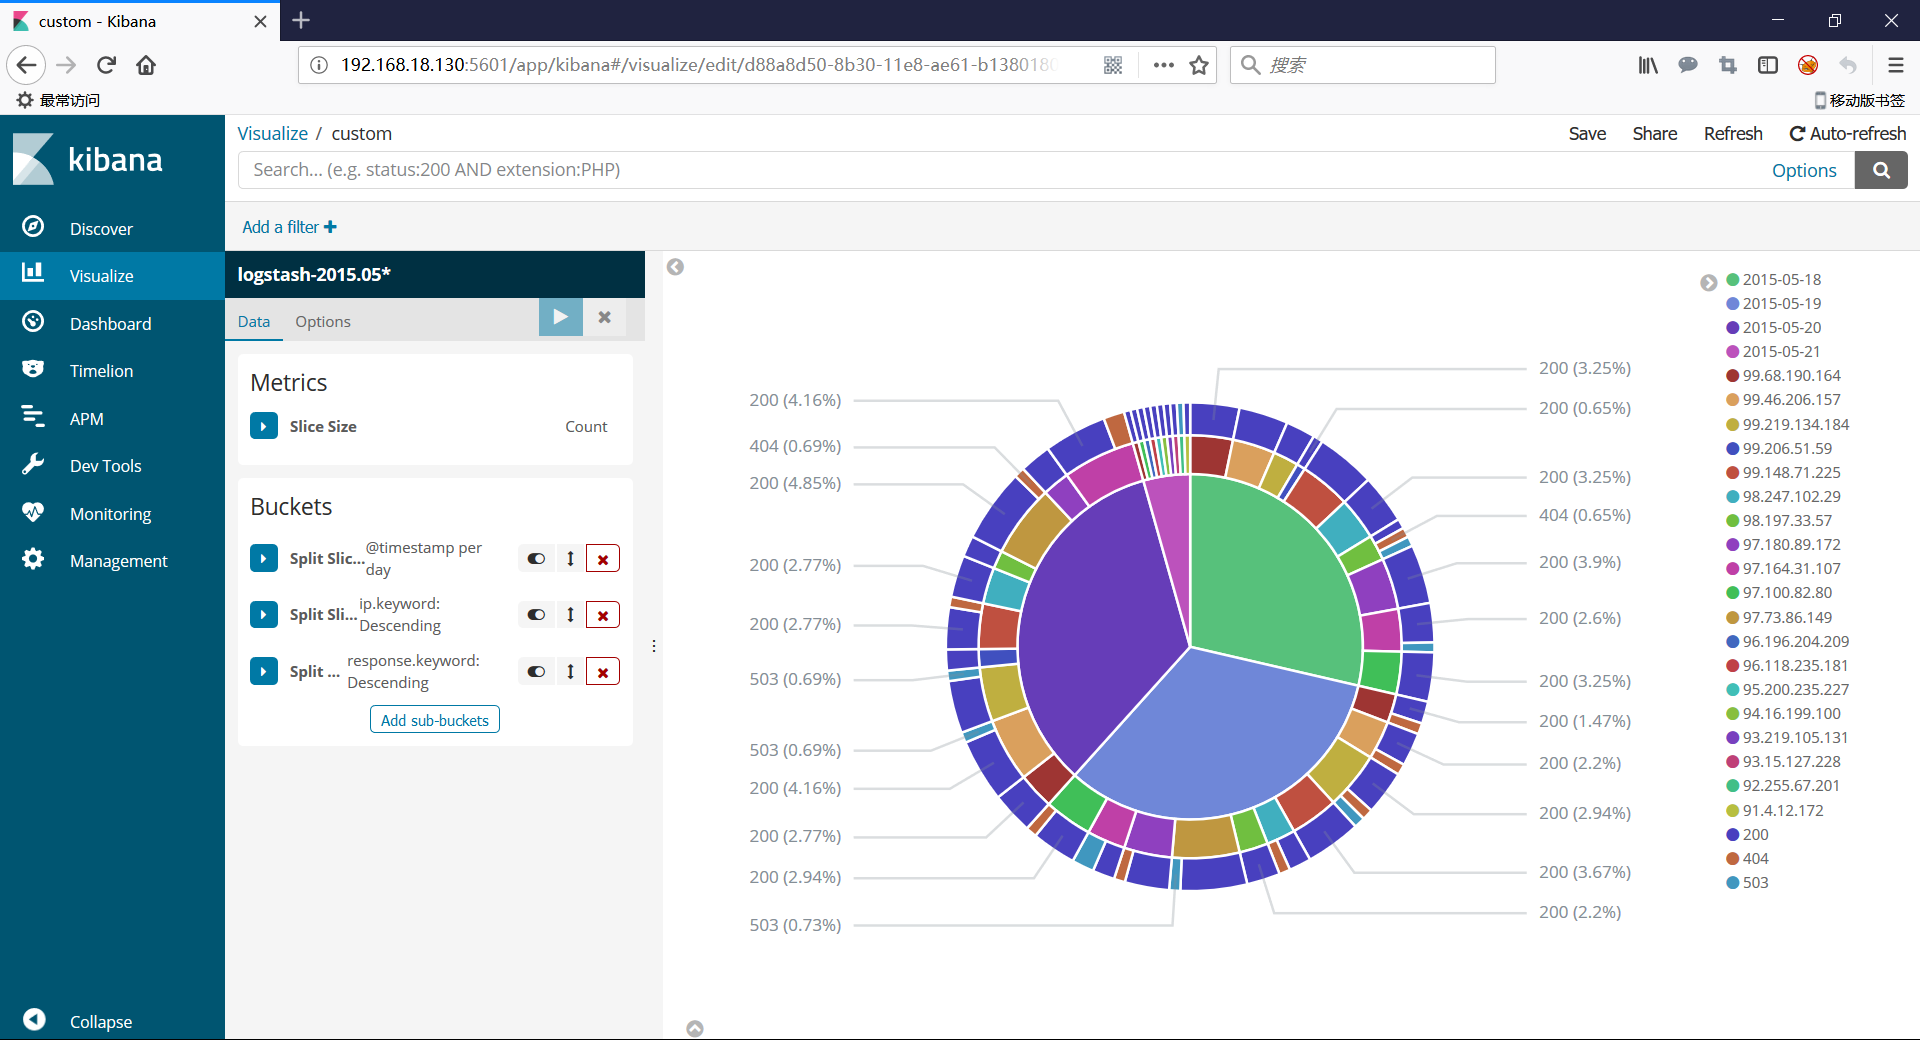
 下图展示的是一个饼图,记录各个时间段各个IP的访问请求状态。
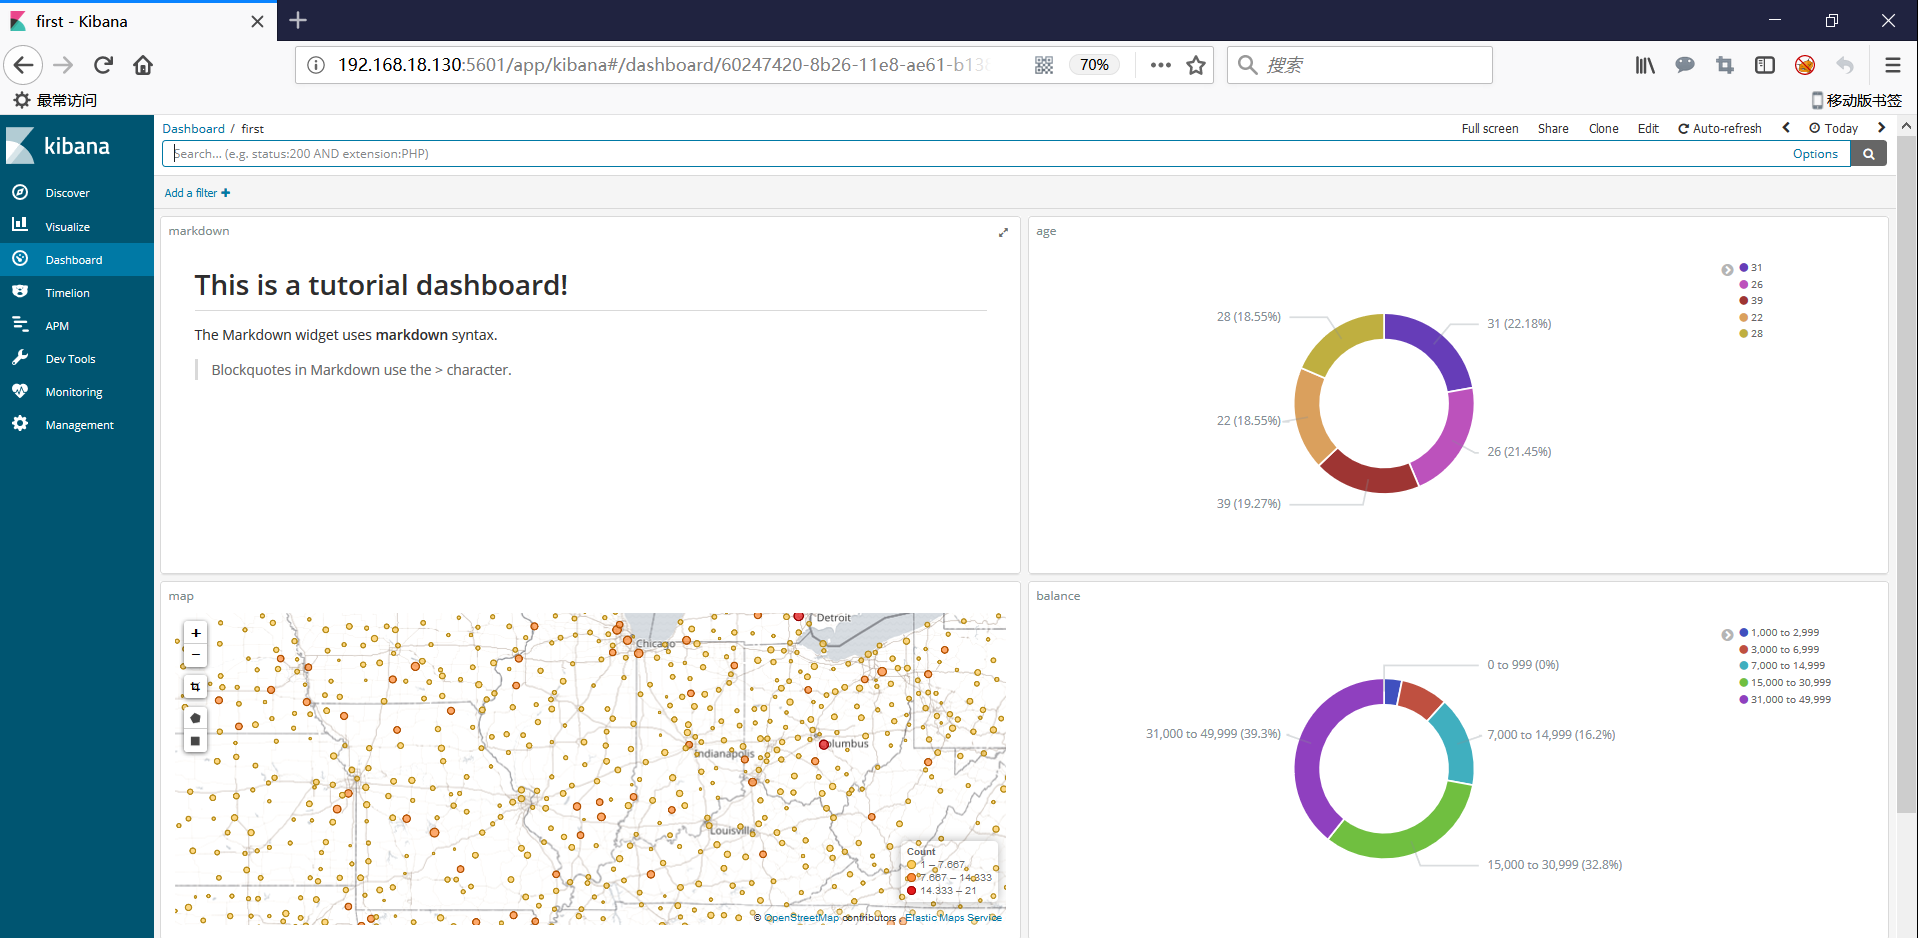
6.4,仪表盘
仪表盘用来展示保存的可视化结果集合。
6.5,时序控件
时序控件是一款时间序列数据可视化工具,它可以将多种独立的数据源合并呈现到一张视图上。
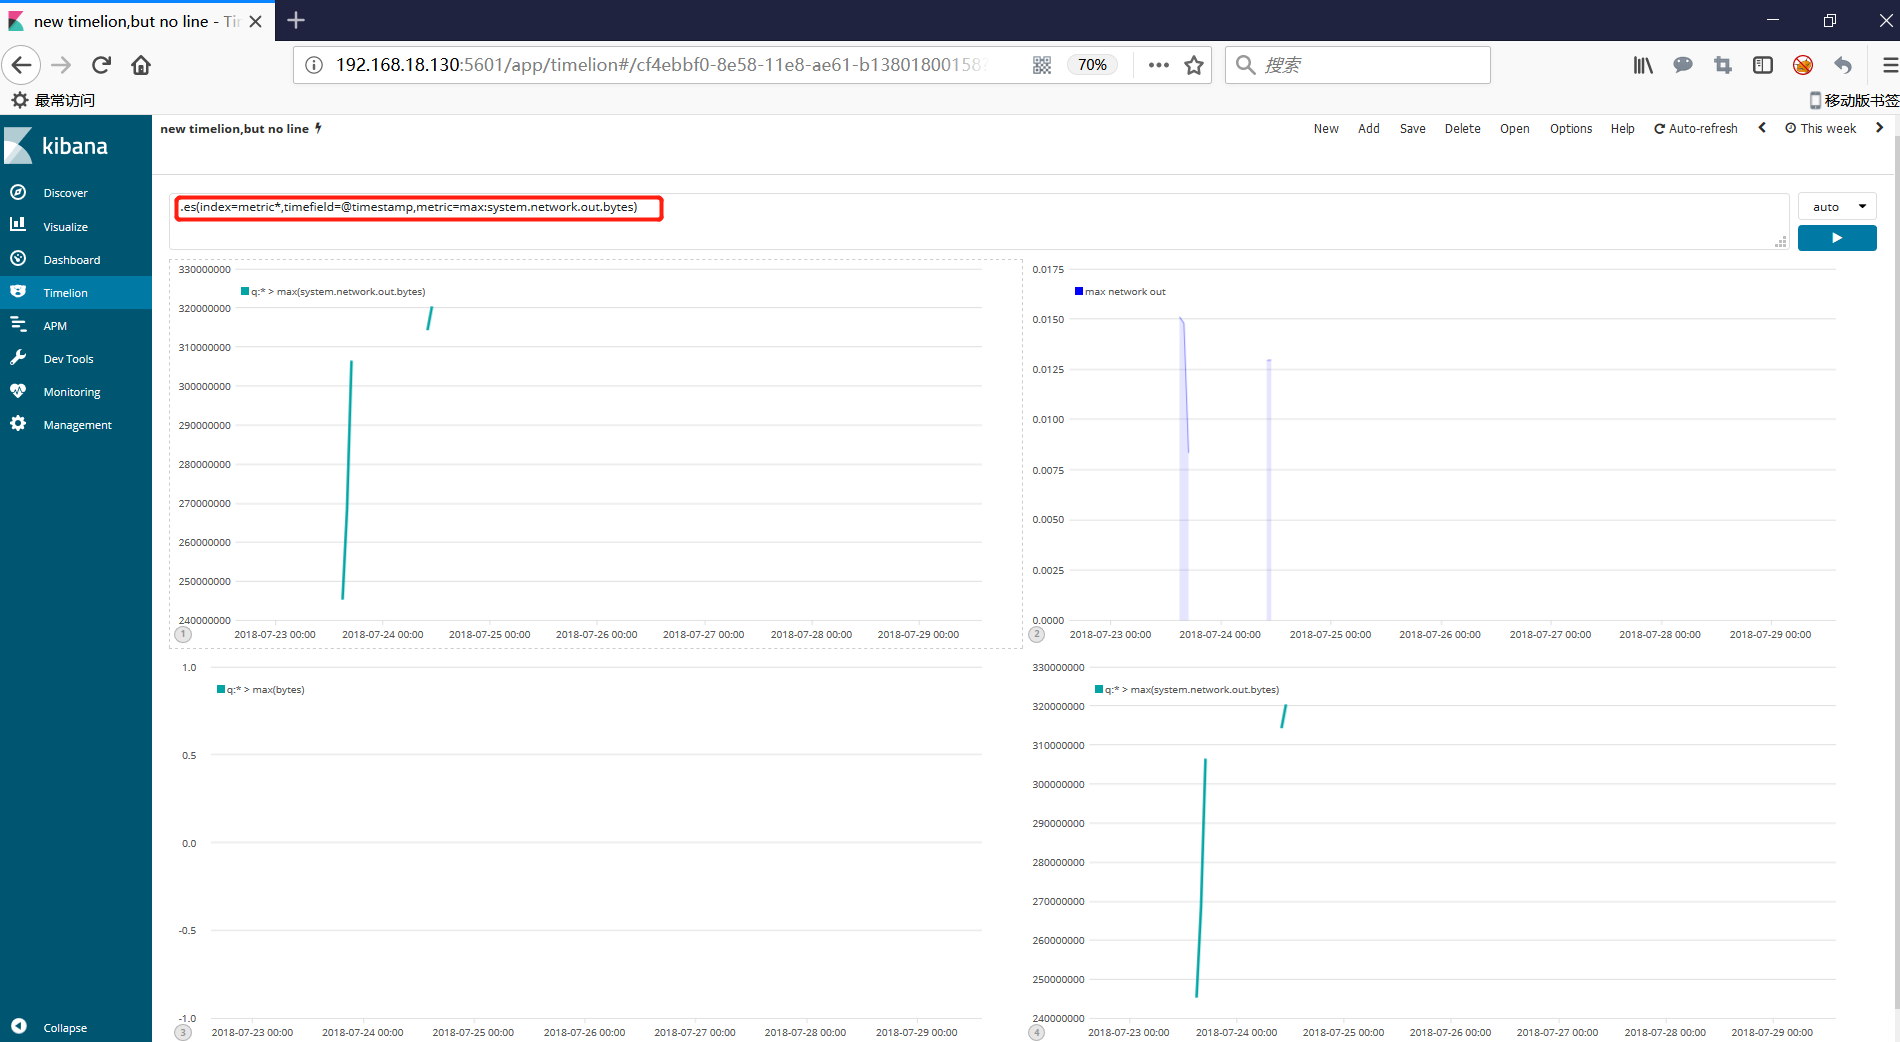
标红处为输入表达式,用来控制想要展示的数据。
来源:freebuf.com 2018-07-24 13:07:48 by: gncao